Chalkboard Infographicv1.0.0
Use this Skill to create explainer graphics.
Rising
5.058 downloads1 likes1 saves
Free
Turn a lesson, process, or data story into a readable chalkboard-style infographic with clear hierarchy, concise copy, and original illustrations. It helps educators, creators, and teams make one takeaway easier to grasp and share without turning the image into a dense slide.
Picked most often by
Updated Sep 22, 2026
Preview gallery
Runs in
Generates with
Similar Skills
View all skillsWhat you get
- A finished 16:9 chalkboard infographic with one clear reading path, short exact labels, and a visible takeaway
- A locked visual recipe for charcoal texture, warm white line art, restrained colored chalk accents, spacing, and type hierarchy
- Six composition patterns plus prompt recipes for cycles, processes, annotated objects, comparisons, timelines, and small quantitative stories
- A text and thumbnail QA checklist, with a deterministic overlay route when copy is too important to leave to image generation
Good fit
- Educators and course creators turning one lesson or framework into a memorable visual
- Content teams making article graphics, workshop recaps, or social explainers from short briefs
- Designers who want a repeatable chalkboard style without copying a reference poster
Not for
- Dense reports, long-form reading, or dashboards with many small numbers
- Photorealistic scenes, polished corporate vector art, or glossy 3D graphics
- Requests to reproduce a branded poster, copyrighted character, or unlicensed reference composition
Content Publishing & Article VisualsTeaching & ExplainersSocial Content & CampaignsCreate Explainer GraphicsCreate InfographicLogic-firstStyle-lockedText-accurateHand DrawnChalk TextureChalkboardDoodle InfographicLimited Palette
About this Skill

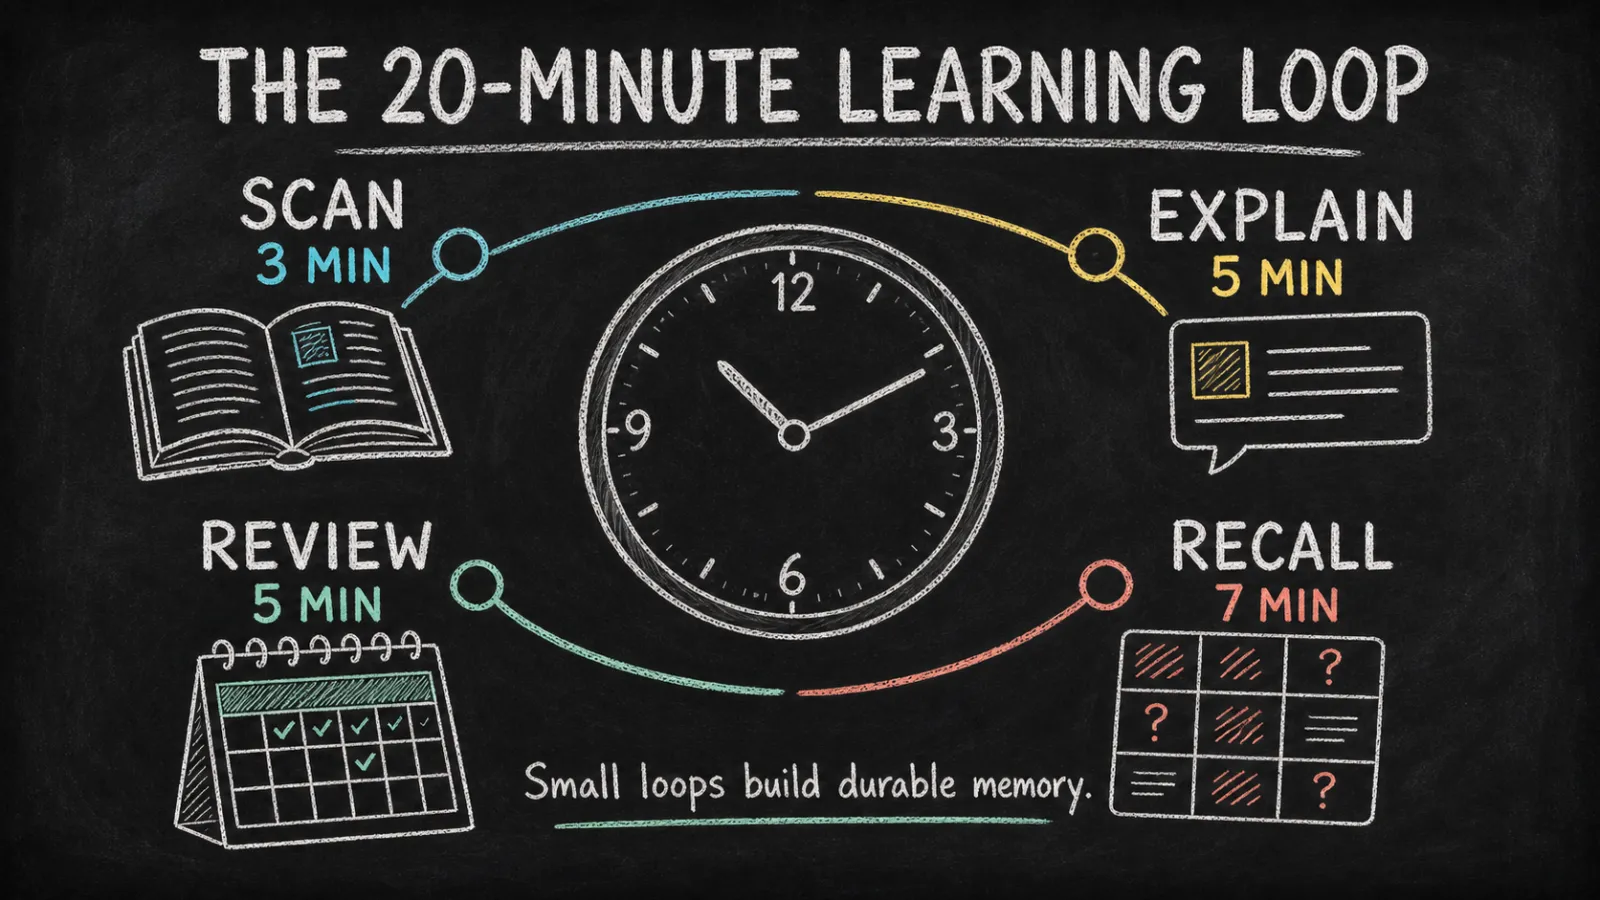
Turn a short lesson, process, or comparison into a chalkboard graphic that reads in seconds. You get the texture of real chalk and erased dust, but the message stays crisp: one title, one reading path, a few hand-drawn explanations, and a takeaway worth remembering.
What you get
- A finished 16:9 infographic with a clear title, three to five information groups, and short exact labels
- A repeatable look: matte charcoal, warm white line art, restrained cyan, yellow, coral, and mint accents, plus subtle powder and erased marks
- Composition recipes for loops, processes, annotated objects, comparisons, timelines, and small quantitative stories
- A copy check at full size and thumbnail size, with a safer external typesetting route when the words are too important to trust to generated lettering
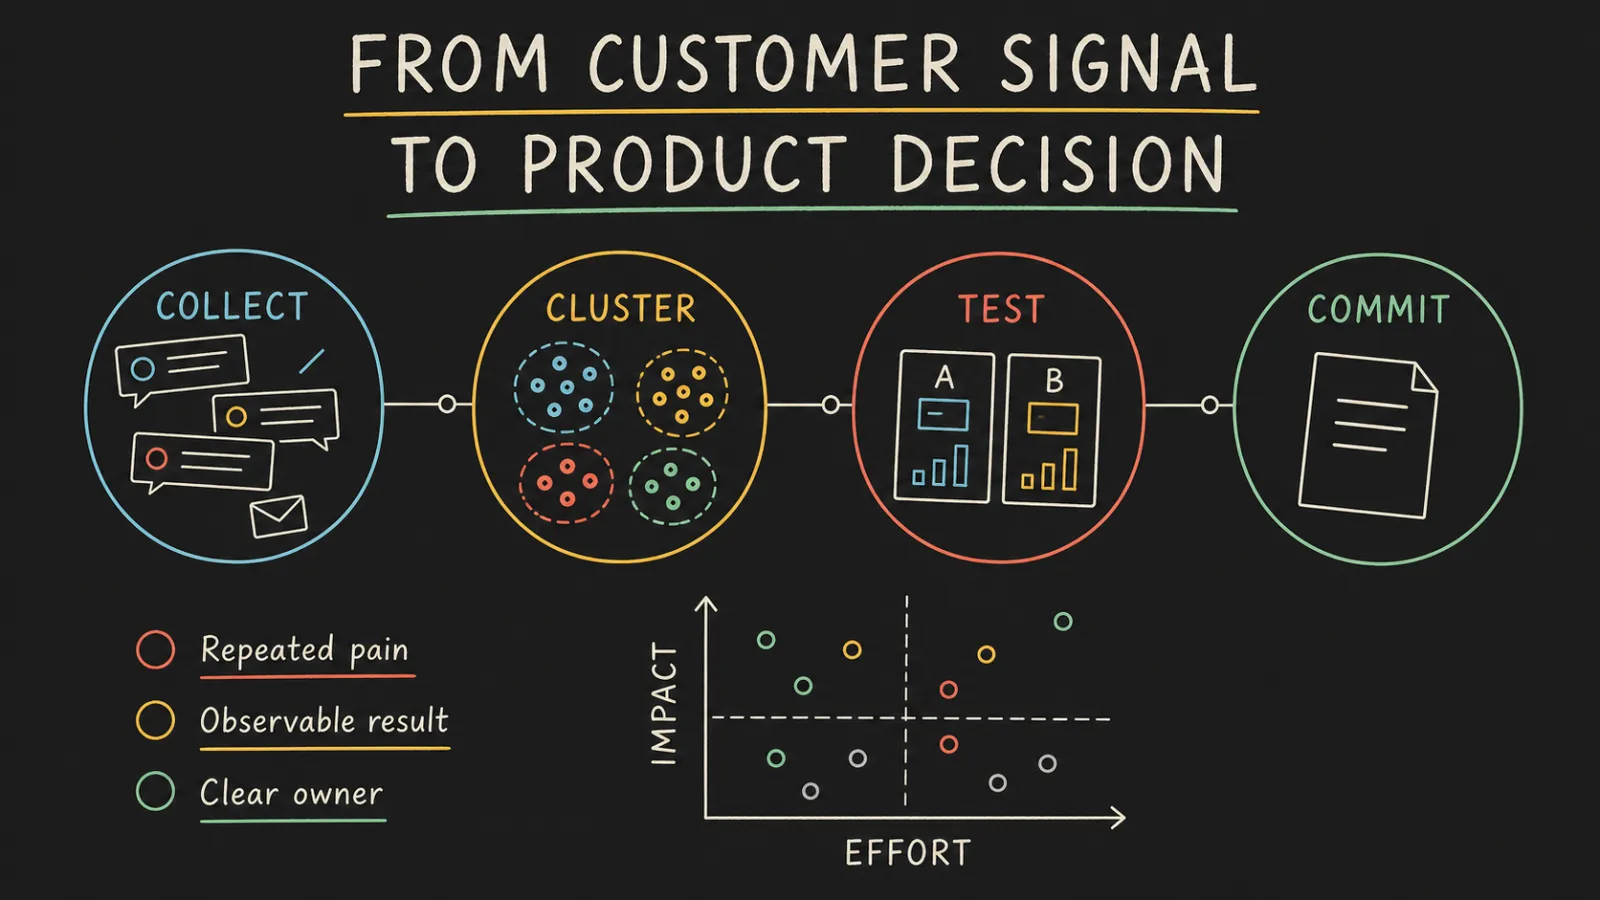
How to use
- Give it your brief, exact labels, numbers, units, and the one thing the viewer should remember
- Choose a reading path, or let it pick the structure that fits the idea
- Review the first result for wording and clarity, then request one focused adjustment at a time
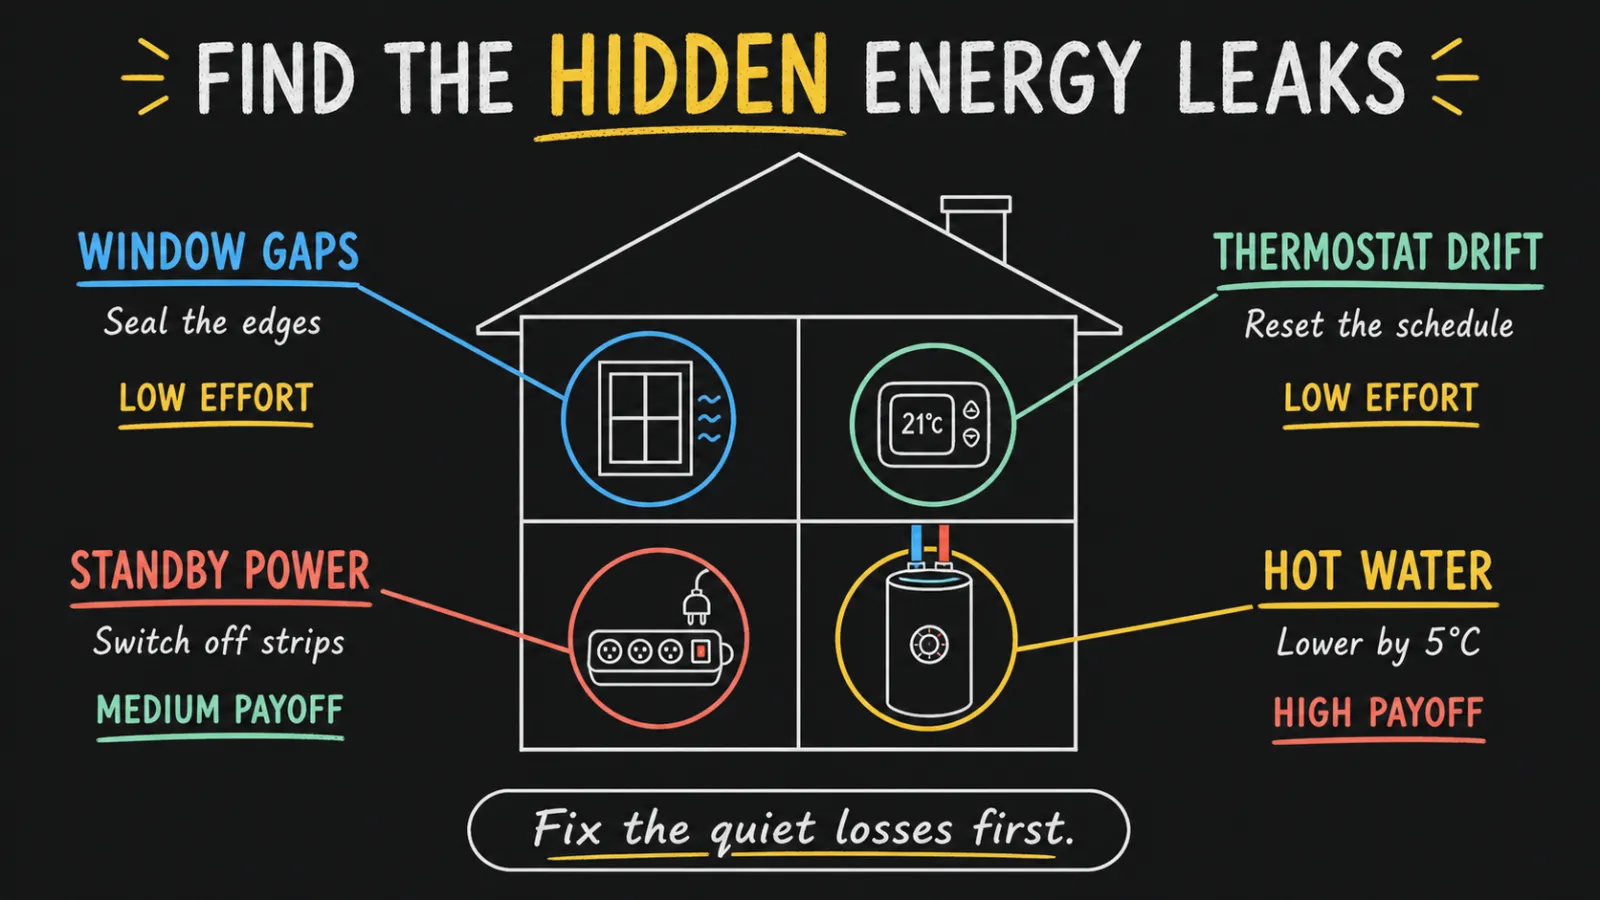
You need a FAL API key, and each generated image incurs a usage charge.
What you need before you start
- You bring
- A brief, source passage, or list of facts with one main takeaway · Any exact words, numbers, units, or labels that must appear
- Dependencies
- FAL account and FAL_KEY - required · Node.js 20 or newer - required
- Outside costs
- Each FAL generation or edit uses paid GPT Image credits. The bundled runtime persists the request ID, disables provider retries, and never submits an automatic replacement task.
- Last tested
- v1.0.0 — Claude Code / Claude Desktop / Cowork / Codex / ChatGPT
User reviews
Loading reviews…